Japanese
English
- 有料閲覧
- Abstract 文献概要
- 1ページ目 Look Inside
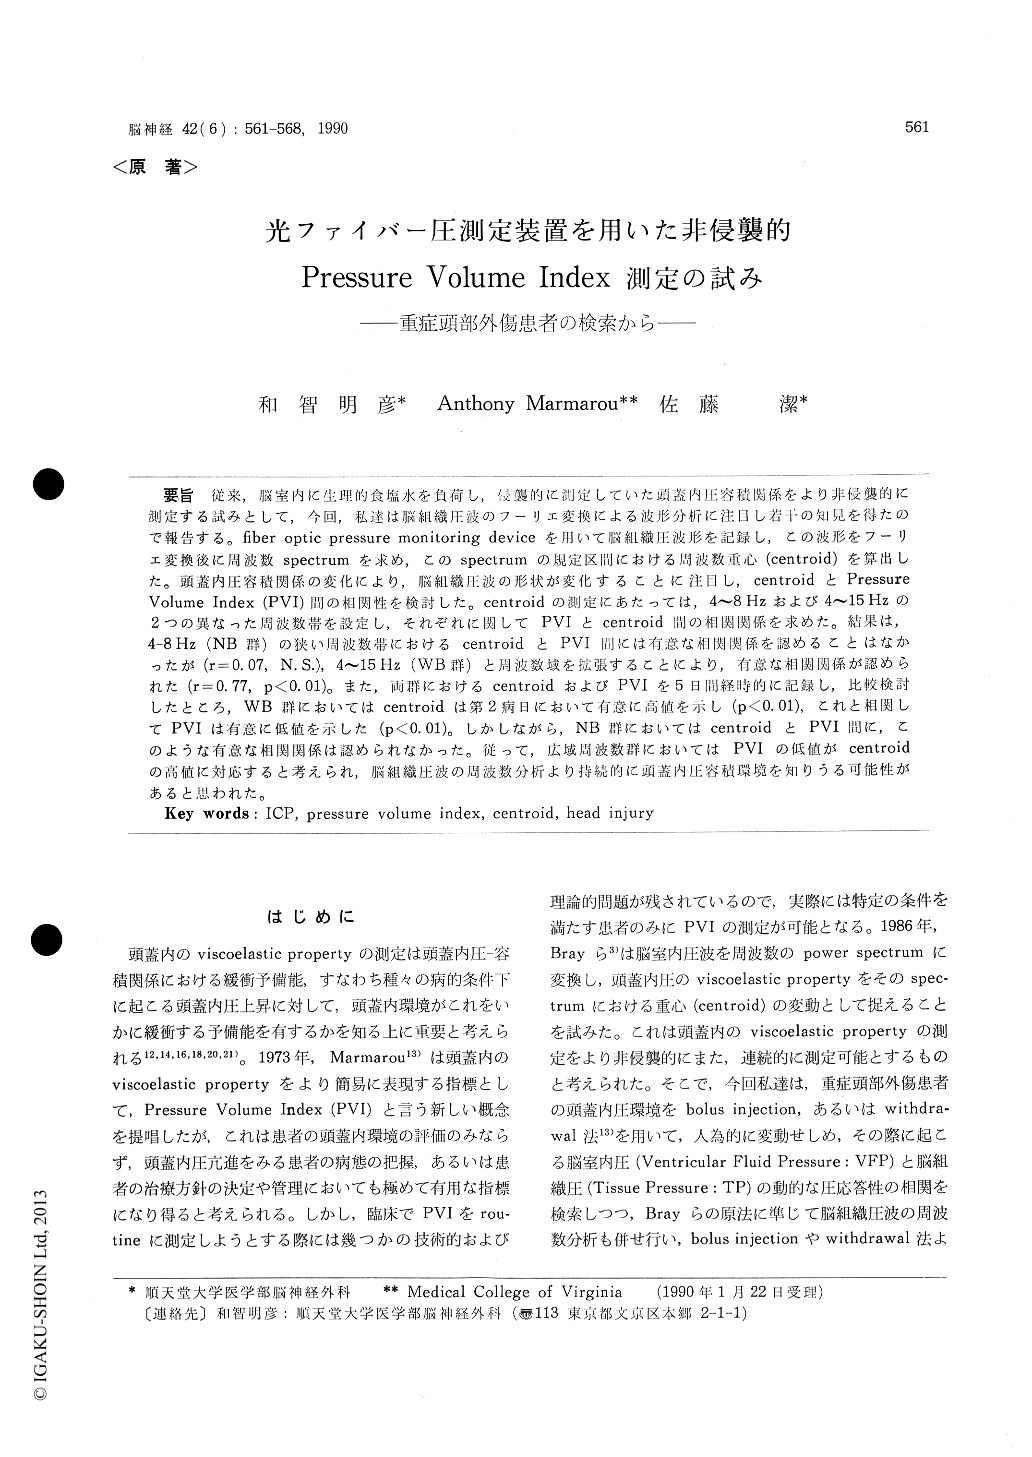
従来,脳室内に生理的食塩水を負荷し,侵襲的に測定していた頭蓋内圧容積関係をより非侵襲的に測定する試みとして,今回,私達は脳組織圧波のフーリエ変換による波形分析に注目し若干の知見を得たので報告する。fiber optic pressure monitoring deviceを用いて脳組織圧波形を記録し,この波形をフーリエ変換後に周波数spectrumを求め,このspectrumの規定区間における周波数重心(centroid)を算出した。頭蓋内圧容積関係の変化により,脳組織圧波の形状が変化することに注目し,centroidとPressureVolume Index(PVI)間の相関性を検討した。centroidの測定にあたっては,4〜8Hzおよび4〜15Hzの2つの異なった周波数帯を設定し,それぞれに関してPVIとcentroid間の相関関係を求めた。結果は,4-8Hz(NB群)の狭い周波数帯におけるcentroidとPVI間には有意な相関関係を認めることはなかったが(r=0.07, N.S.),4〜15Hz(WB群)と周波数域を拡張することにより,有意な相関関係が認められた(r=0.77, P<0.01)。また,両群におけるcentroidおよびPVIを5日間経時的に記録し,比較検討したところ,WB群においてはcentroidは第2病日において有意に高値を示し(P<0.01),これと相関してPVIは有意に低値を示した(P<0.01)。しかしながら,NB群においてはcentroidとPVI間に,このような有意な相関関係は認められなかった。従って,広域周波数群においてはPVIの低値がcentroidの高値に対応すると考えられ,脳組織圧波の周波数分析より持続的に頭蓋内圧容積環境を知りうる可能性があると思われた。
At present, method for determining pressure volume status in head injured patients must be obtained via analysis of pressure response to bolus injections into the ventricular catheter system13,20). The concept introduced by Bray3) of extracting Pressure Volume Index (PVI) measures from analysis of the pulse pressure centroid presents a less invasive technique and provides PVI data continuously. The objective of this study was to test the application of the system which incor-porated the Bray concept to PVI measures in head injured patients. The centroid of frequency power specturm was provided continuously by a computer system linked to the bedside monitor. The com-puter incorporated the Bray concept for PVI esti-mation. These values were compared with PVI measured by conventional bolus technique. We tested the system using ICP pulsating wave form delivered from a fiberoptic pressure monitoring system in brain tissue in two different band-width (Narrow band-width : 4~8 Hz, Wide band-width :4~15 Hz). PVI studies using bolus fluid injection or withdrawal were conducted at least twice a day and usually each study consisted of 3 to 6 injec-tions or withdrawals to obtain a study average PVI.
These study average were correlated with the centroid obtained during the same study interval in 17 head injured patients of Glasgow Coma Scale (GCS) 8 or less. The correlation of the centroid and PVI in the wide band-width group was signi-ficant (p<0.01, r=0.77), however, in the narrow band-width group, the correlation was not signifi-cant (r= 0.07, N. S.). The temporal course of PVI in the WB group showed the minimum values on day 2 (p<0.01), and the maximum value of cent-roid noted on same day (p<0.01). However, no correlation was found in the NB group.
In summary, the analysis of tissue pressure wave form by FFT and spectrum centroid for the auto-mated detection of PVI shows promise and with further refinement of the computer programs, could serve as a reliable estimation of PVI continuously.

Copyright © 1990, Igaku-Shoin Ltd. All rights reserved.


