Japanese
English
- 有料閲覧
- Abstract 文献概要
- 1ページ目 Look Inside
I.はじめに
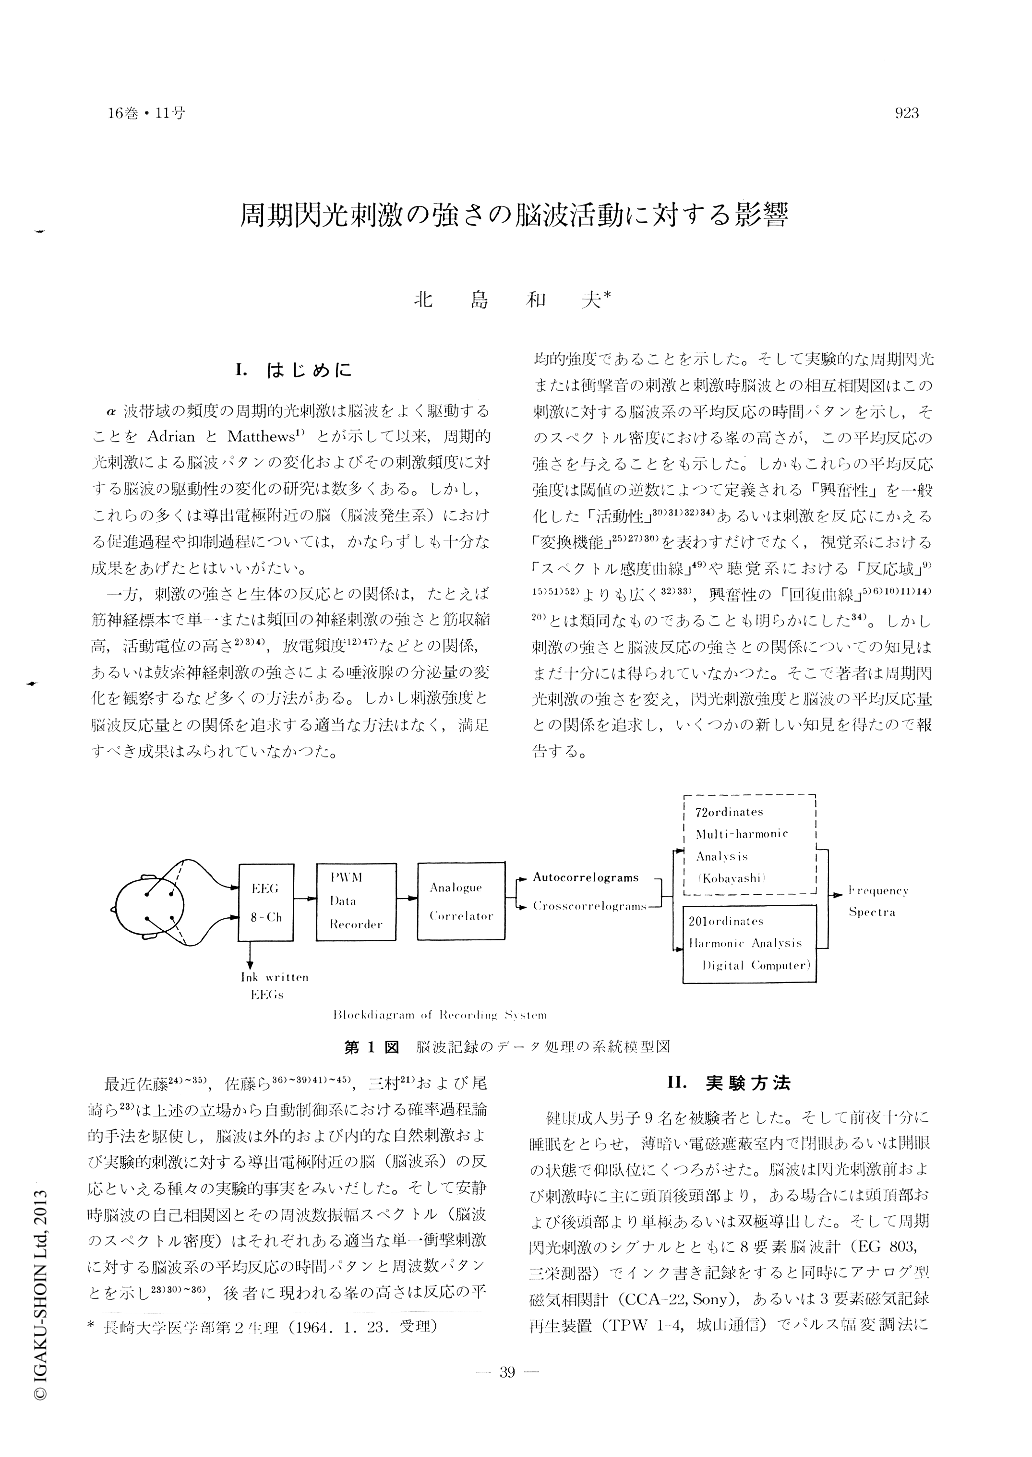
α波帯域の頻度の周期的光刺激は脳波をよく駆動することをAdrianとMatthews1)とが示して以来,周期的光刺激による脳波パタンの変化およびその刺激頻度に対する脳波の駆動性の変化の研究は数多くある。しかし,これらの多くは導出電極附近の脳(脳波発生系)における促進過程や抑制過程については,かならずしも十分な成果をあげたとはいいがたい。
一方,刺激の強さと生体の反応との関係は,たとえば筋神経標本で単一または頻回の神経刺激の強さと筋収縮高,活動電位の高さ2)3)4),放電頻度12)47)などとの関係,あるいは鼓索神経刺激の強さによる唾液腺の分泌量の変化を観察するなど多くの方法がある。しかし刺激強度と脳波反応量との関係を追求する適当な方法はなく,満足すべき成果はみられていなかつた。
Though it is well known that alpha waves will be driven by photic flicker stimulation of alpha wave frequency, little is known about the influence of the intensity of the stimulation. Attempts were made, therefore, to elucidate the influence of three grades of stimulating intensities (weak, intermediate and strong) upon normal adult EEG response. EEGs were traced bipolarily from the occipital or parieto-occipital regions or monopolarily with an indifferent electrode placed on the ear lobe. Auto- and cross-correlograms (average time-patterns) of EEGs were obtained by analogue correlator (Sony, CCA-22), and their frequency spectra (average frequency-pat-terns) were computed by ordinate double harmo-nic analysis (Kobayashi's numerical method) or 201 ordinate harmonic analysis by the aid of Parametron digital computer MI-B. Stimulations were delivered for 65-90 sec and correlation analysis of EEGs were performed on the latter 35-48 sec.
Regular damped oscillations of about 10 cps were verified in the autocorrelograms of resting control EEGs which showed monomodal peaks in their fre-quency spectra, During stimulation of alpha wave frequency (7.5, 8, 9, 9.5, 11.5 cps, etc.), oscillations in the autocorrelograms of EEGs, which show low voltage fast patterns, were of longer duration than that of the control. In their spectra, in addition to the peaks of 10 cps, new peak (s) of the stimulating frequency and/or its high harmonic frequency ap-peared in most instances, whereby the height of the former peaks was lowered. And only the latter peaks were observed in the spectrum of the cros-scorrelogram between the stimulation and the EEG. Both depressive and augmentative processes may, therefore, be noted in the arousal EEG patterns. In the typical response, changes in the heights of peaks were roughly proportional to the relative logarithmic intensity of the photic flicker stimulation. Though the height of driven peaks increased from weak to intermediate intensities of stimulation in many instances, it became lower by strong stimulation.

Copyright © 1964, Igaku-Shoin Ltd. All rights reserved.


