Japanese
English
- 有料閲覧
- Abstract 文献概要
- 1ページ目 Look Inside
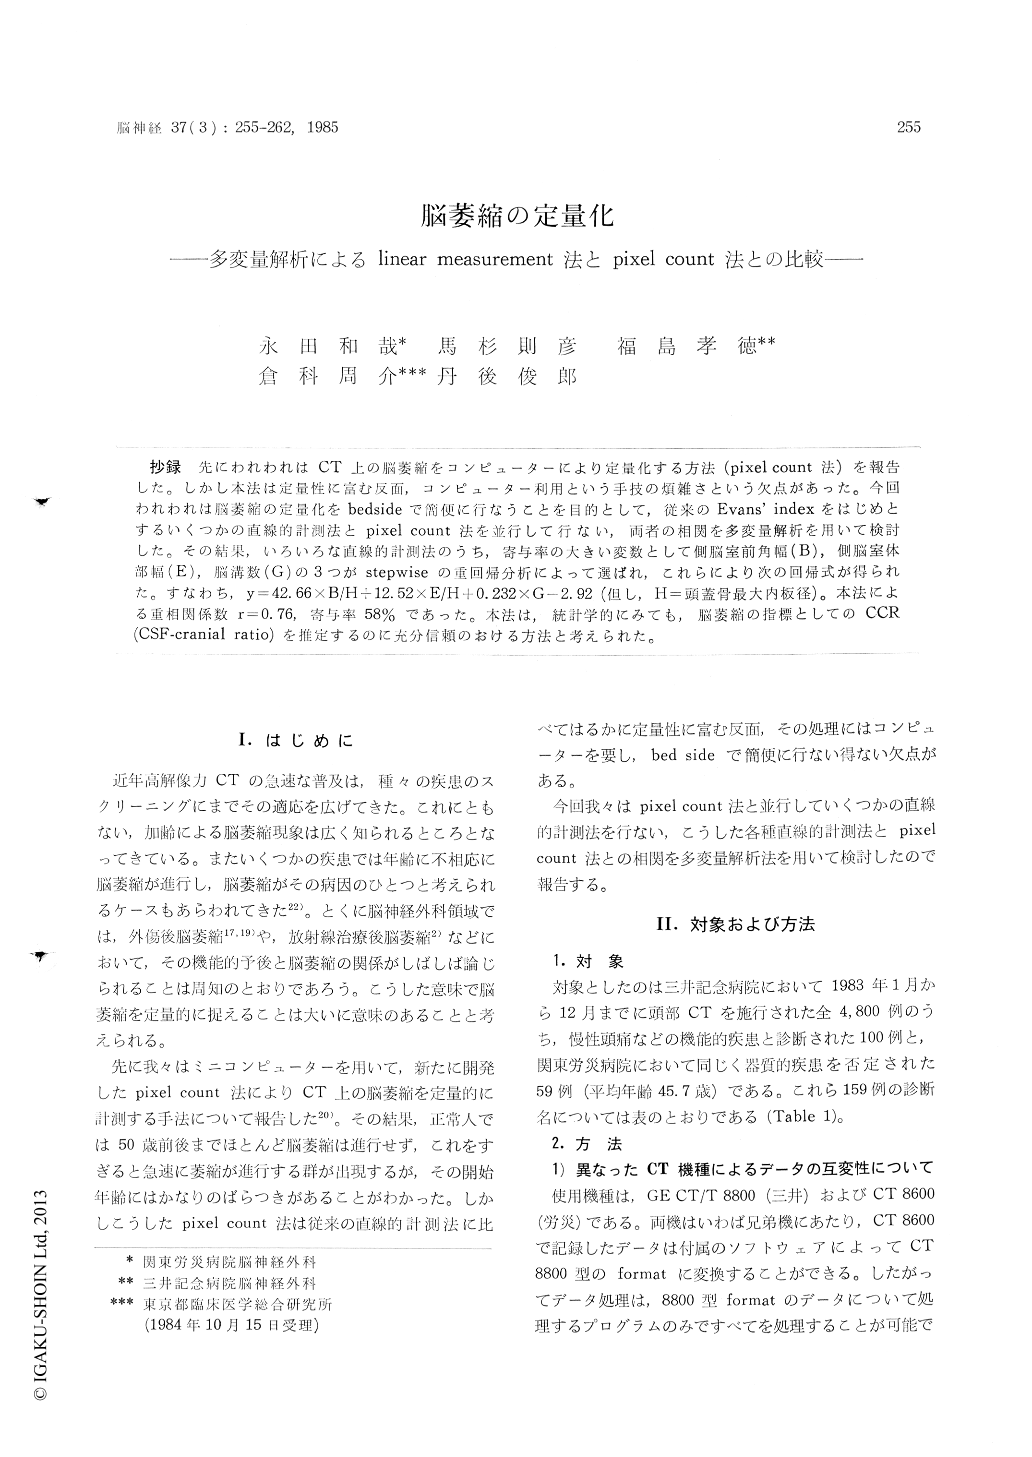
抄録 先にわれわれはCT上の脳萎縮をコンピューターにより定量化する方法(pixel coumt法)を報告した。しかし本法は定量性に富む反面,コンピューター利用という手技の煩雑さという欠点があった。今回われわれは脳萎縮の定量化をbedsideで簡便に行なうことを目的として,従来のEvans' indexをはじめとするいくつかの直線的計測法とpixel count法を並行して行ない,両者の相関を多変量解析を用いて検討した。その結果,いろいろな直線的計測法のうち,寄与率の大きい変数として側脳室前角幅(B),側脳室体部幅(E),脳溝数(G)の3つがstepwiseの重回帰分析によって選ばれ,これらにより次の回帰式が得られた。すなわち,y=42.66×B/H+12.52×E/H+0.232×G−2.92(但し,H=頭蓋骨最大内板径)。本法による重相関係数r=0.76,寄与率58%であった。本法は,統計学的にみても,脳萎縮の指標としてのCCR(CSF-cranial ratio)を推定するのに充分信頼のおける方法と考えられた。
We previously reported the newly developed quantitative mesurement of the cerebral atrophy. The data indicated that the volume of the cereb-rospinal fluid not always gradually increases during the life course but remains relatively constant until age 50 and thereafter increases with awide variation. Though the technique, which is called the pixel count method, is highly quantita-tive, it is quite troublesome as it needs the com-puter to count out each pixels. On the other hand, the linear measurement method is easier than the pixel count method, but is far less quantitative.
We examined seventy four subjects using both the linear measurement method and the pixel count method, and compared them by means ofthe multivariant analysis. Three different linear measurement methods were selected by the step-wise multiple regression analysis, those are B (distance between the caudate nuclei), E (greatest distance between the lateral ventricles at the level of the cella media) and G (number of visible sulci whose width are more than 3.1 mm at the level of 3 cm above the corpus callosum). B and E were calibrated by the maximum internal width of the skull (H). The highest correlation was achieved with a formula employing these parameters as follows ;
y=42.66 x B/H+12.52xE/H+0.232xG-2.92 (y means the estimated value of the CCR (CSF-cranial ratio), which is obtained by deviding the CSF volume by the cranial cavity). Multiple cor-relation coefficient was O.76, and was statistically significant (p<0.001). The authors emphasized that using this formula we can easily predict CCR as the index of the brain atrophy without any computer.

Copyright © 1985, Igaku-Shoin Ltd. All rights reserved.


