Japanese
English
- 有料閲覧
- Abstract 文献概要
- 1ページ目 Look Inside
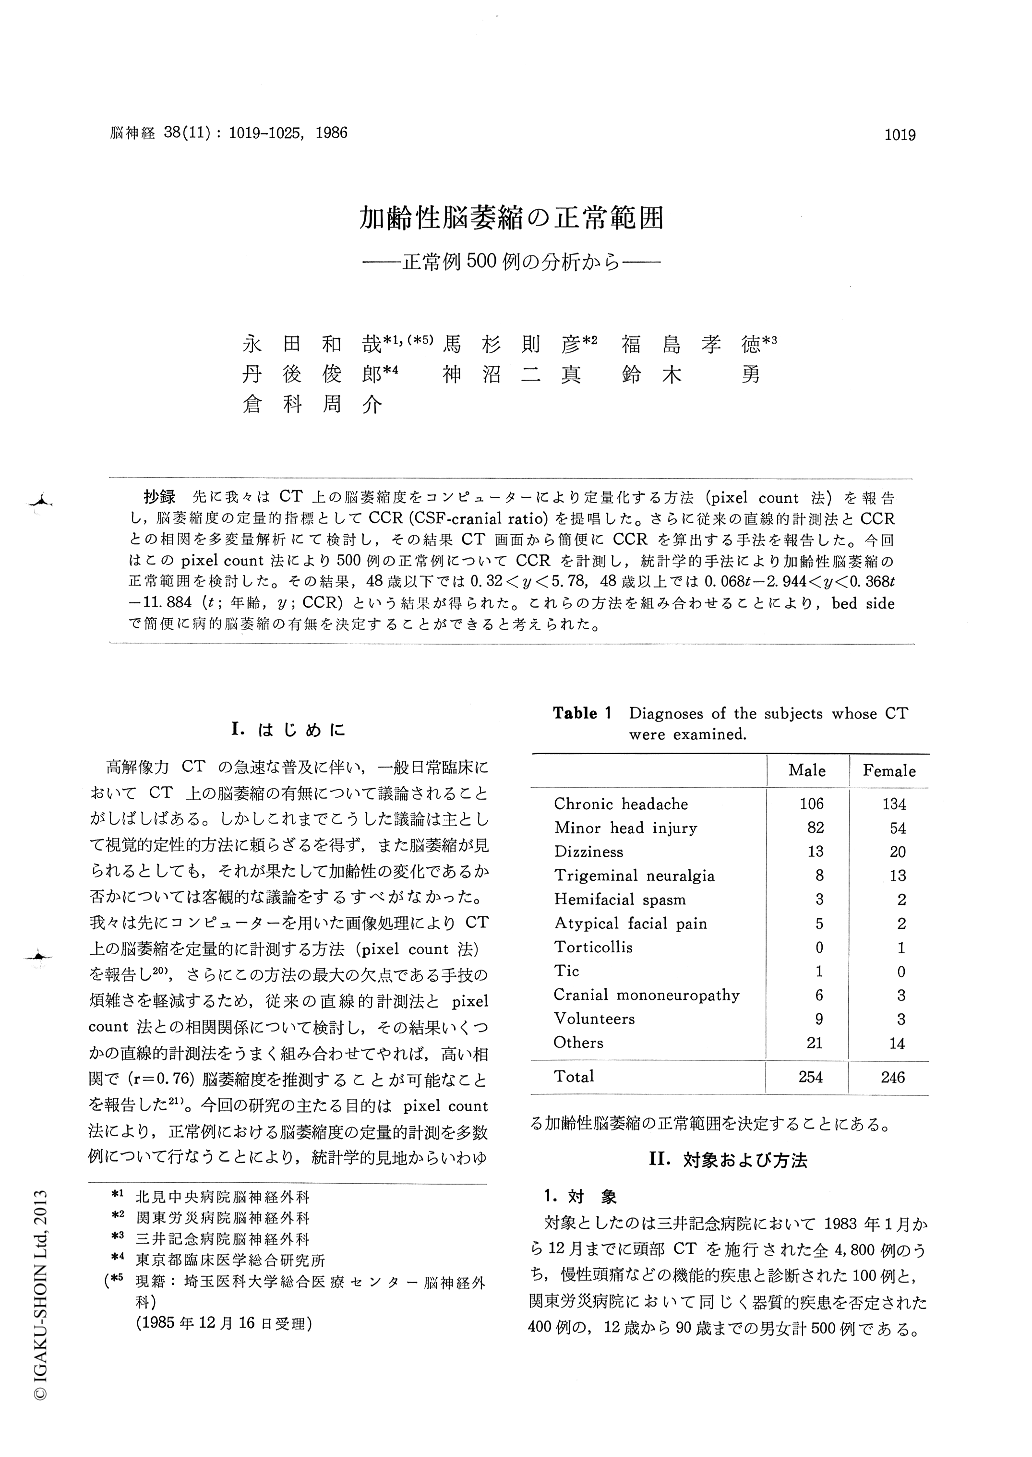
抄録 先に我々はCT上の脳萎縮度をコンピューターにより定量化する方法(pixel count法)を報告し,脳萎縮度の定量的指標としてCCR (CSF-cranial ratio)を提唱した。さらに従来の直線的計測法とCCRとの相関を多変量解析にて検討し,その結果CT画面から簡便にCCRを算出する手法を報告した。今回はこのpixel count法により500例の正常例についてCCRを計測し,統計学的手法により加齢性脳萎縮の正常範囲を検討した。その結果,48歳以下では0.32<y<5.78,48歳以上では0.068t−2.944<y<0.368t−11.884(t;年齢,y;CCR)という結果が得られた。これらの方法を組み合わせることにより,bed sideで簡便に病的脳萎縮の有無を決定することができると考えられた。
We previously reported the newly developed quantitative measurement of the cerebral atrophy (pixel count method), and abvocated the value CCR (CSF-cranial ratio) as the index of the volu-metric measurement of the cerebral atrophy. As the pixel count method is somewhat troublesome, we tried to compare the various linear measure-ment methods with pixel count method by means of multivariant analysis, and reported a single formula to calculate CCR from the linear measure-ment methods. Now we studied 500 normal sub-jects using the pixel count method and examined the normal range of the cerebral atrophy during aging by means of the maximum likelihood me-thod. The normal range was estimated as follows; 0.32<y<5.78 (t<48), 0.068t-2.944<y<0.368 t-11.884 (t>48). Using these formula and this newly reported normal range, we can easily predict whether the cerebral atrophy is pathological or not.

Copyright © 1986, Igaku-Shoin Ltd. All rights reserved.


