Japanese
English
- 有料閲覧
PPV購入案内
1,320円 (1,200円+税10%) こちらは、1097ページから1101ページの文献です。購入には医書.jp本会員登録が必要です。
会員登録完了後に改めて上記「購入サイトへ」を選択してください。
または「購入サイトへ」選択後に「購入ログイン」、「新規会員登録」の順に進んでください。
会員登録について詳しくはをご確認ください。
- Abstract 文献概要
- 1ページ目 Look Inside
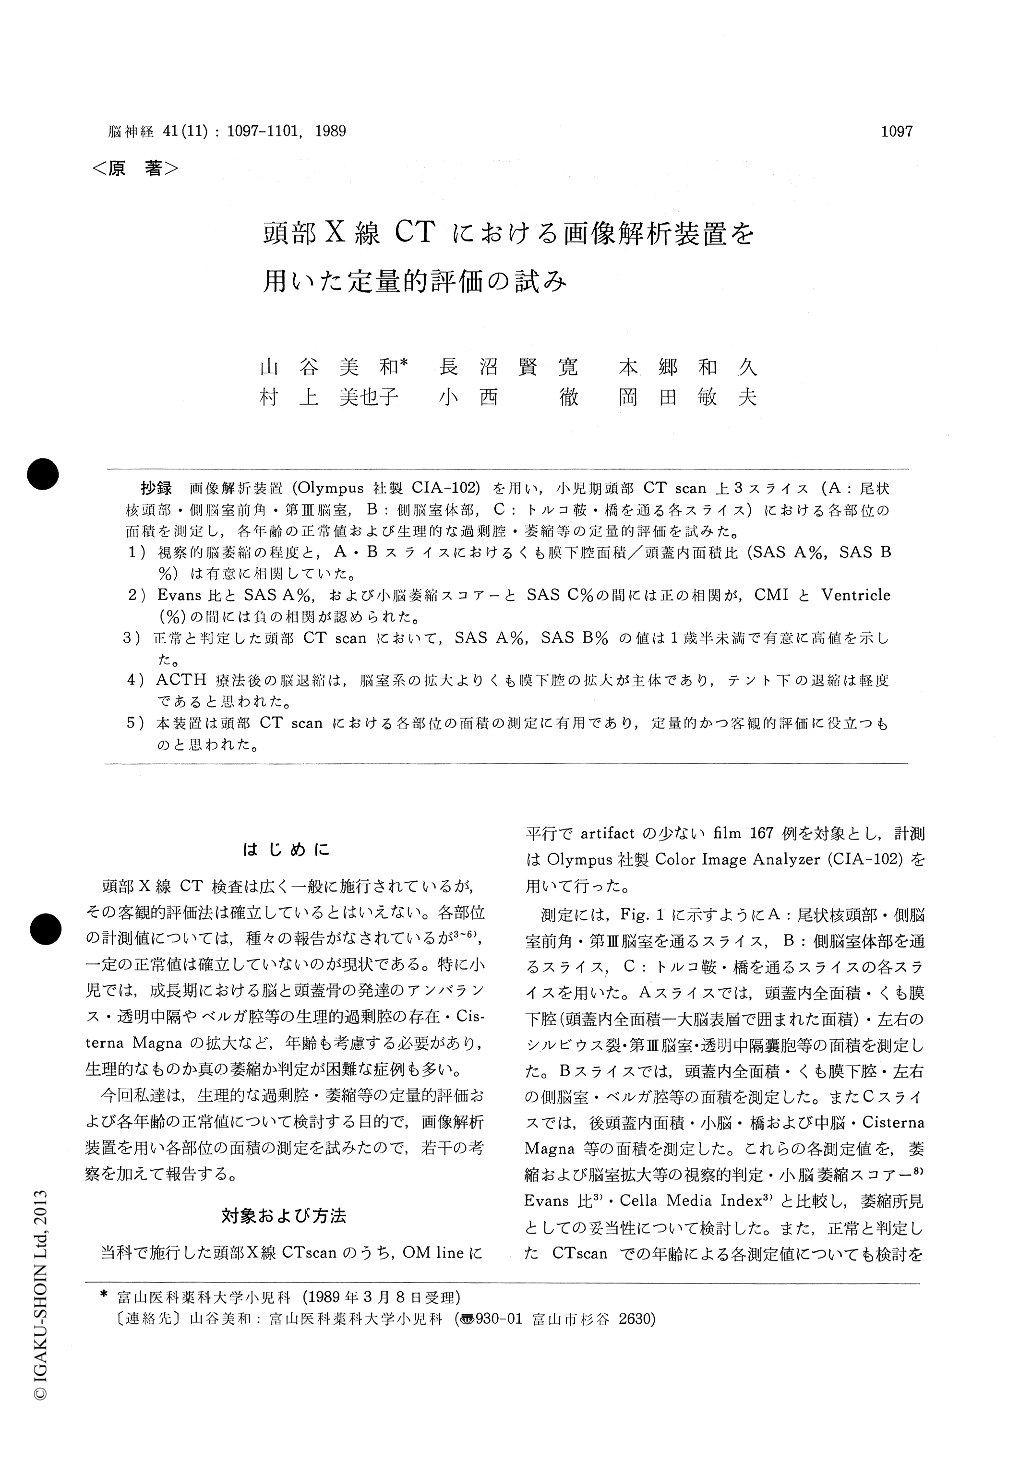
抄録 画像解析装置(Olympus社製CIA−102)を用い,小児期頭部CT scan上3スライス(A:尾状核頭部・側脳室前角・第皿脳室,B:側脳室体部,C:トルコ鞍・橋を通る各スライス)における各部位の面積を測定し,各年齢の正常値および生理的な過剰腔.萎縮等の定量的評価を試みた。
1)視察的脳萎細の程度と,A・Bスライスにおけるくも膜下腔面積/頭蓋内面積比(SAS A%,SAS B%)は有意に相関していた。
2) Evans比とSAS A%,および小脳萎細スコアーとSAS C%の間には正の相関が,CMIとVentricle(%)の間には負の相関が認められた。
3)正常と判定した頭部CT scanにおいて,SAS A%,SAS B%の値は1歳半未満で有意に高値を示した。
4) ACTH療法後の脳退縮は,脳室系の拡大よりくも膜下腔の拡大が主体であり,テント下の退縮は軽度であると思われた。
5)本装置は頭部CT scanにおける各部位の面積の測定に有用であり,定量的かつ客観的評価に役立っものと思われた。
We attempted the quantitative analysis of brain computerized tomographic scans in children using Color Image Analyzer. A consecutive seires of 167 computerized tomographic scans were reviewed. Areas of subarachnoid spaces, cavums, ventricles and cerebellums were measured on three slices : A slice is at the level of head of caudate nucleus, anterior horn of lateral ventricle and third vent-icle. B slice is at the level of body of lateral ventricle. C slice is at the level of sella turcica and pons. We investigated these values compared with Evans ratio, Cella Media Index, cerebellar atrophy score and visually evaluations. Serial brain CT scans of eight patient with infantile spasmswere also evaluated for the assessment of the brain shrinkage after ACTH therapy.
1) The ratios of the subarachnoid space/the int-racranial area on A and B slices (SAS A%, SAS B%) were significantly higher in the patients of severe brain atrophy.
2) There were linear relationship between Evans ratio and SAS A% (r= 0.405, p <0.001), Cella Media Index and the ratio of the lateral ventric-les/the intracranial areas on B slice (r=-0.501, p<0.001), and the cerebellar atrophy score by Une and SAS C% (r=0.369, p<0.001)
3) In the normal patients, the values of SAS A% and SAS B% were much greater in less than 1.5 years old children. These results suggest that the trend of CT findings related to age may re-flect physiological changes of the space between the skull and the brain with age.
4) Brain shrinkage after ACTH therapy was more pronounced in the subarachnoid space than the ventricle. The prognosis of infantile spasms concerning convulsive attacks was relatively good in patients with severely brain shrinkage after ACTH therapy.
5) Quantative analysis of brain CT scans seemed to be available to clinical and objective evalua-tions.
Copyright © 1989, Igaku-Shoin Ltd. All rights reserved.